STRTGY · Feb 2025
Comprehensive Data Analysis Platform for TV Shopping Company
Overview
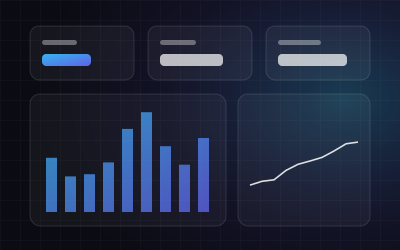
Developed a complete data analysis and business visualization ecosystem consisting of three interconnected projects: a RESTful API backend (FastAPI), an interactive dashboard (React), and a report generation platform (Flask with AI). Implemented a RESTful API with FastAPI that provides access to analytical data stored in MongoDB, with endpoints for different dimensions of business analysis.
Highlights
- 01
Designed and developed an interactive dashboard with React 18 and Material UI 6 for business KPI visualization, implementing visualizations with Recharts, D3.js, and React Leaflet.
- 02
Created a data-driven decision-making solution, implementing KPIs for sales trends, customer segmentation, inventory turnover, and advertising effectiveness through interactive dashboards.
- 03
Employed K-means clustering for customer segmentation and created interactive chloropleth maps using GeoJSON data, revealing geographical patterns in sales and customer behavior.
- 04
Integrated Google Trends data using time series analysis to anticipate consumer interests, informing inventory management and marketing strategies.
- 05
Implemented a multi-stage data processing pipeline, extracting data from SQL databases, storing in MongoDB, processing with pandas and numpy, and integrating external APIs for data enrichment.
Stack
- Data Analysis
- Business Intelligence
- FastAPI
- React
- MongoDB
- Dashboard Development
- API Development
- ETL
- Material UI
- Python
- JavaScript
- Data Visualization
- Microservices
- SQL
- Database Management
- API Integration
- Performance Optimization
Working on something similar?
Tell me about the problem and the data behind it. I reply within 24–48 hours.
Discuss a project